Alcohol sales in BC
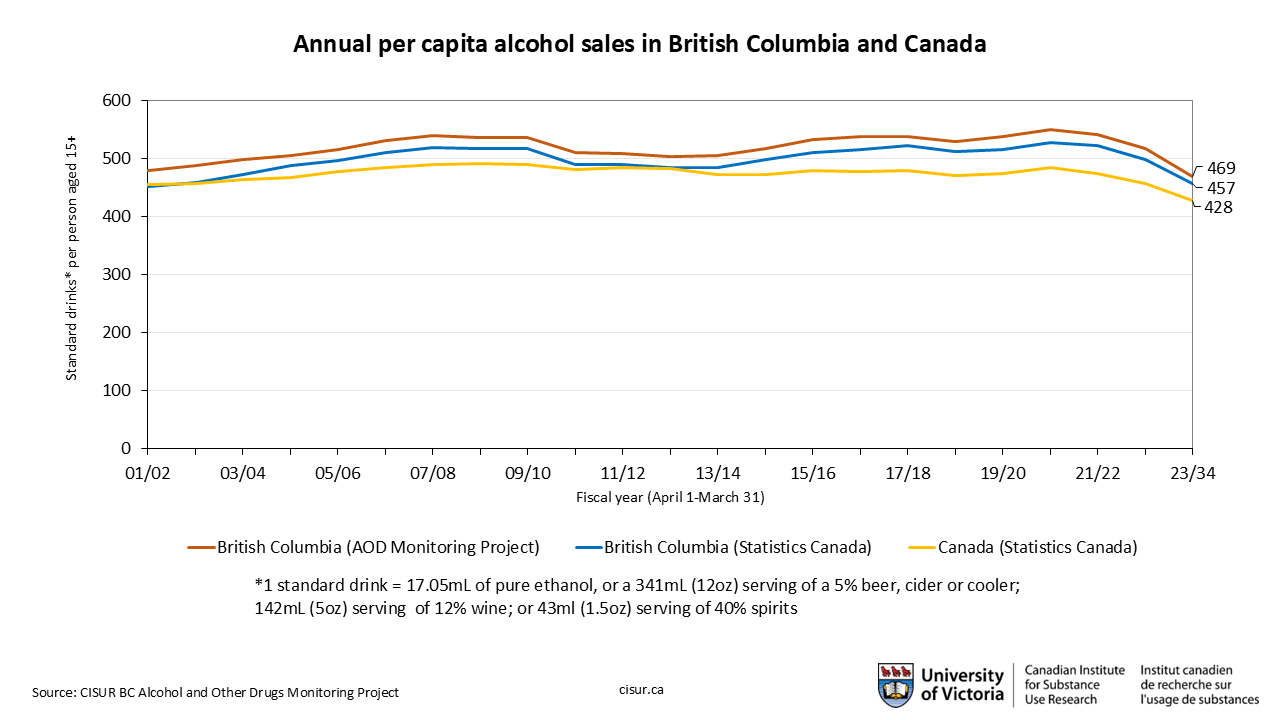
In fiscal year 2024/25 (which goes through March, 2025) the most recent year of our BC Alcohol and Other Drug (BCAOD) Monitoring Project data, BC recorded a decrease of 0.54L in per capita (aged 15+) sales of pure alcohol (ethanol), down to 7.42 L from 7.96 L. The current total is equivalent to 435 standard drinks (SDs) per person over the age of 15 per year (including non-drinkers), a decrease of about 7 percent compared with 2023/24.
2024/25 is the fourth consecutive year-over-year decrease in sales of pure alcohol in BC. These declines seem to have accelerated beyond a post-COVID adjustment and are more likely to be representative of structural demand declines in the alcohol marketplace. Since the COVID-related sales peak in 2020/21, sales are down almost 20 percent.
This represents the lowest level of per capita ethanol sales since we started monitoring alcohol sales in BC in 2001/02. We have seen a substantial decrease in per-capita sales since record highs in the first year of the COVID-19 pandemic, where annual per-capita sales were estimated at 9.24L, or 542 standard drinks.
There may be several reasons for this continued decline. One is that BC has seen significant population increases over the last few years. Paired with moderate decreases in overall alcohol sales, this has led to lower sales per capita, since new arrivals may drink less, particularly those coming from countries with lower consumption than Canada.
| Fiscal year | Litres of pure alcohol sold in BC | BC population aged 15+ | Litres per capita (15+) | Standard drinks per capita (15+) |
| 2020/21 | 39,747,919 | 4,453,544 | 9.24 | 541 |
| 2021/21 | 39,531,037 | 4,515,202 | 9.05 | 531 |
| 2022/23 | 38,875,180 | 4,654,323 | 8.65 | 507 |
| 2023/24 | 37,099,256 | 4,830,119 | 7.96 | 467 |
| 2024/25 | 35,506,099 | 4,965,644 | 7.42 | 435 |
Other factors in the decrease may be increased knowledge in Canada regarding alcohol and health, including the high-profile January 2023 release of Canada’s Guidance on Alcohol and Health. High inflation and other cost-of-living factors that affect both the cost of alcohol (see “Average alcohol prices over time,” below) and other goods and services may also contribute to this decline.
Using slightly different methodology than our BCAOD estimate, Statistics Canada also reported a national decrease from 428 SDs (7.3L) in 23/24 to 339 SDs (6.8L) in 24/25. Statistics Canada’s BC per capita numbers went from 457 SDs (7.8L) in 23/24 to 422 SDs (7.2 L), a pattern consistent with our monitoring.
Our BCAOD Monitoring Project estimates show similar trends, but can provide more accurate data than Statistics Canada for a number of reasons:
- Estimates of U-Brew and U-Vin sales (i.e., home-produced alcohol) are included in the per capita consumption estimates
- More accurate estimates of the ethanol strength of typical alcoholic beverages are used (this is needed to do standard drink calculations)
- More up-to-date population estimates from BC Statistics are used (the population denominator is used to calculate per capita consumption)
Note that due to updated BC population estimates from BC Statistics, historic per capita consumption estimates have increased since last year’s update. Read more about our methodology.
You can view and download interactive maps and data tables of AOD alcohol consumption in BC (2002/03-2023/24, broken down by Health Authority, Health Service Delivery Area and Local Health Area, as well as venue and beverage type) via our AOD Trend Analyzer Tool.
Sales by beverage type
- Want to know how many standard drinks are in an alcohol container? Try our drink calculator.
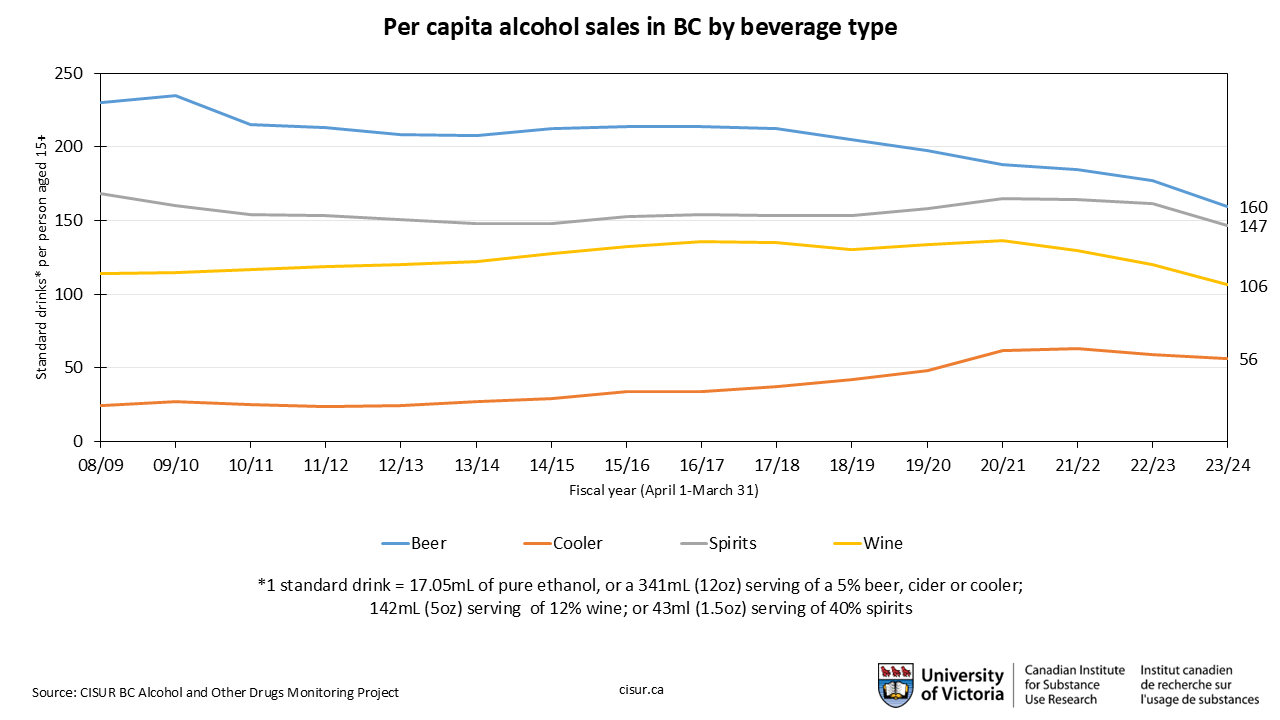
When we look at annual per capita sales by beverage type, beer continues to be the beverage of choice at 147 standard drinks (SDs) aged 15+ (2.51L). Although its share continues to fall, beer made up 34% of the market by pure alcohol volume in 2024/25. This is part of a long-term trend; beer sales have fallen over 40 percent since 2009/10. Spirits also decreased this year to 123 SDs annually per person (or 2.1L). Wine has fallen to 111 SDs (1.9L) in 2024/25. Coolers were the only beverage category that didn’t see a significant decline, only falling by 3 SD to 53 SDs (0.91L). “Coolers” represent a broad category of flavored alcoholic beverages that have proliferated in recent years that include wine coolers, ciders, canned cocktails, hard seltzer, etc.
Note that due to updated BC population estimates from BC Statistics, historic per capita consumption estimates may have changed since last year’s update– the estimates for all years now incorporate the most up-to-date population statistics. Read more about our methodology.
Sales by venue and outlet density
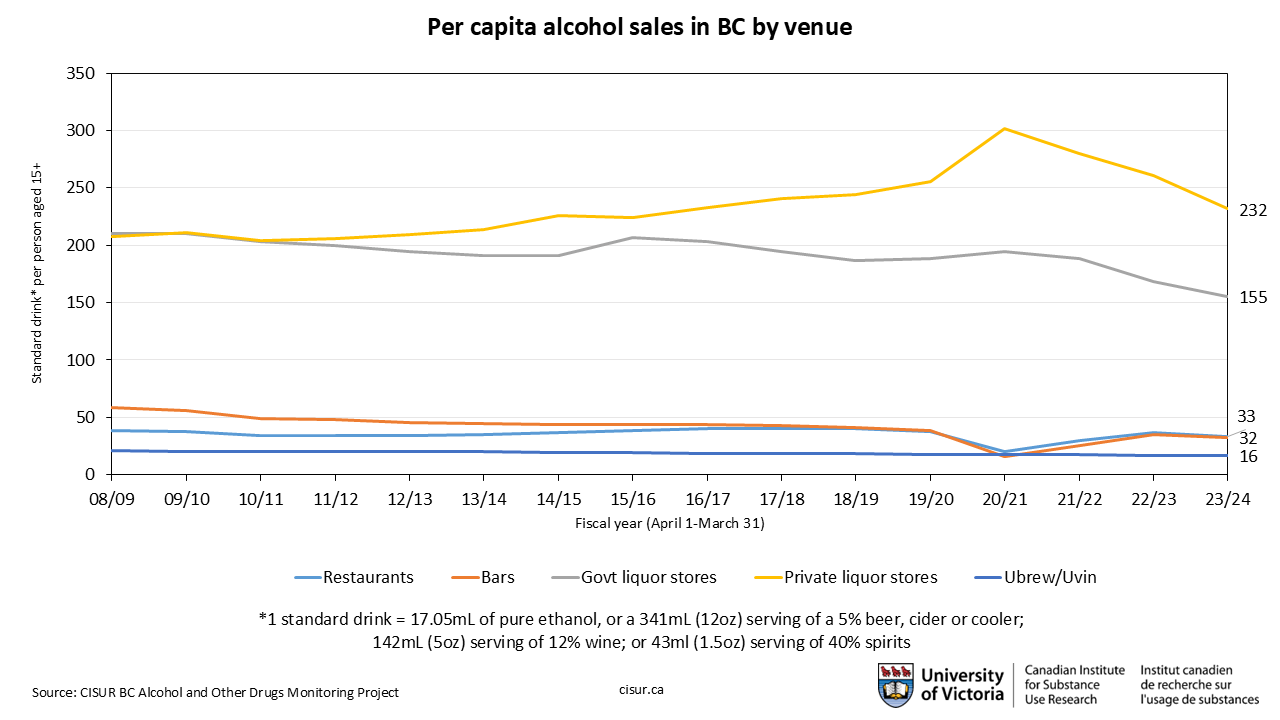
Private liquor stores continue to be the most popular venue for British Columbians to buy alcohol in 2024/25, with 215 standard drinks (SDs) per capita (3.67L) purchased at private stores. This is a decrease from the all-time high of 297 SDs (5.06L) in 2020/21, but still higher than pre-COVID numbers. Nearly 50% of all alcohol sold in BC is purchased at a private liquor store.
Government liquor stores saw a small decline in 2024/25, down to 143 SDs (2.44Ls) from 154 SDs (2.63Ls). Unlike private liquor stores, government store sales are at the lowest they have been since we started tracking this data in 2001/02.
Since the COVID-19 pandemic began in March 2020, BC loosened regulations and expanded services offered by off-premise alcohol outlets, particularly private liquor stores, including increased hours of operation, ramping up of home delivery options, and provincial funding for businesses to develop better online ordering options. Several of these relaxed regulations have now become permanent and are likely to contribute to the increasing privatization of BC’s liquor market. Our previous BC research shows how private liquor stores contribute to increased consumption and harm.
On-premise sales (i.e., those where the alcohol is consumed onsite) in 2024/25 was 31 SDs (0.53Ls) in restaurants and 30 SDs (0.51L) in bars per person aged 15+ in BC. Alcohol purchased at bars and restaurants represent only about 14% of all alcohol purchased in BC.
The estimates provided for UBrew and UVin sales are approximate and are based on observed percentages of total consumption at the beginning of our time series.
Note that due to updated BC population estimates from BC Statistics, historic per capita consumption estimates may have changed since last year’s update– the estimates for all years now incorporate the most up-to-date population statistics.Read more about our methodology.
Outlet density
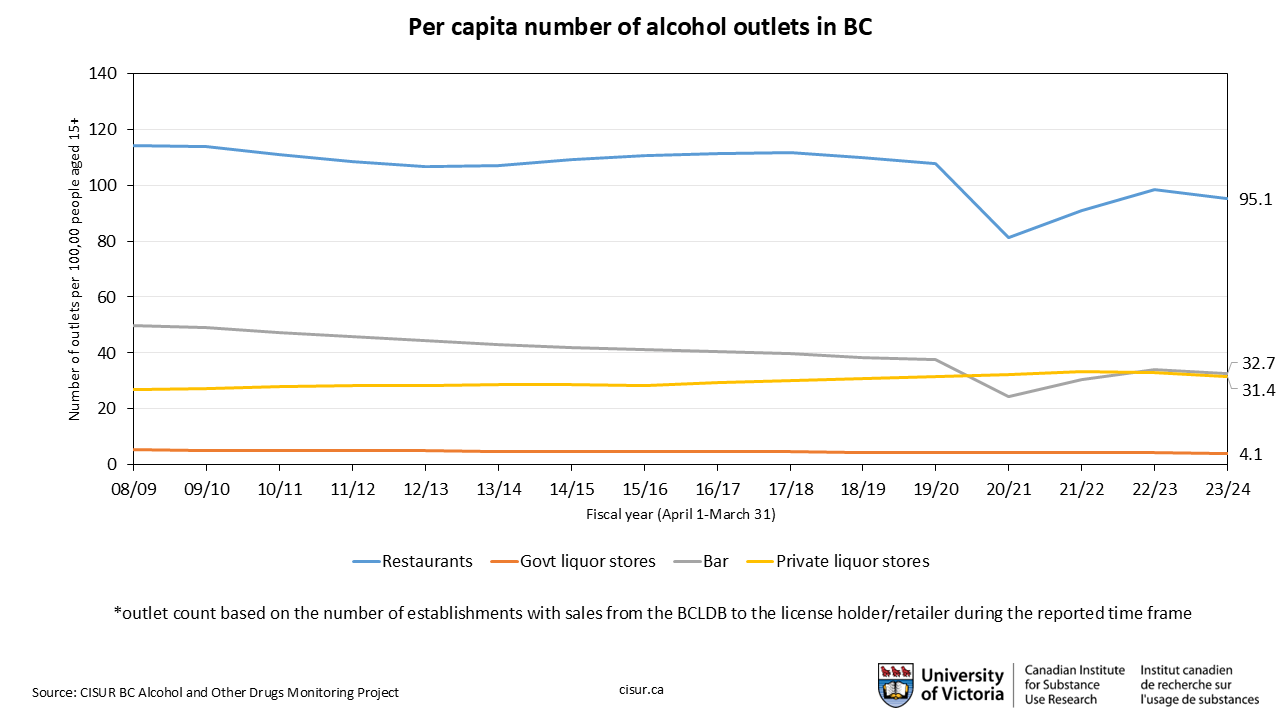
The number of on-premise outlets (restaurants and bars) per capita has rebounded after a large dip in 2020/21 due to COVID-related closures, and are almost back to pre-COVID levels. All per-capita numbers of outlets have decreased slightly since 2023/24, likely due to overall population increases in the province.
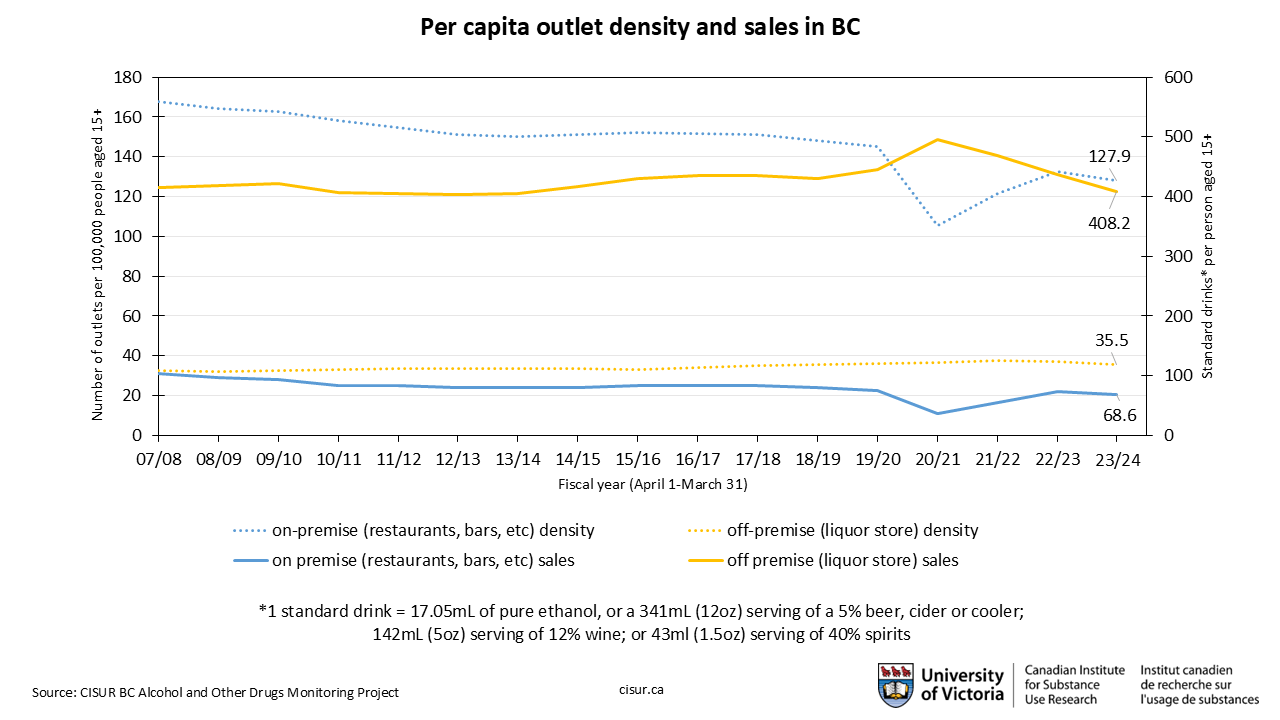
When looking at the relationship between per capita outlet density and consumption, we see that off-premise liquor stores have a much lower density than restaurants and bars but represent a much larger sale of the alcohol consumed in BC.
Note that due to updated BC population estimates from BC Statistics, historic per capita consumption estimates may have changed since last year’s update—the estimates for all years now incorporate the most up-to-date population statistics. Read more about our methodology.
Average alcohol prices over time
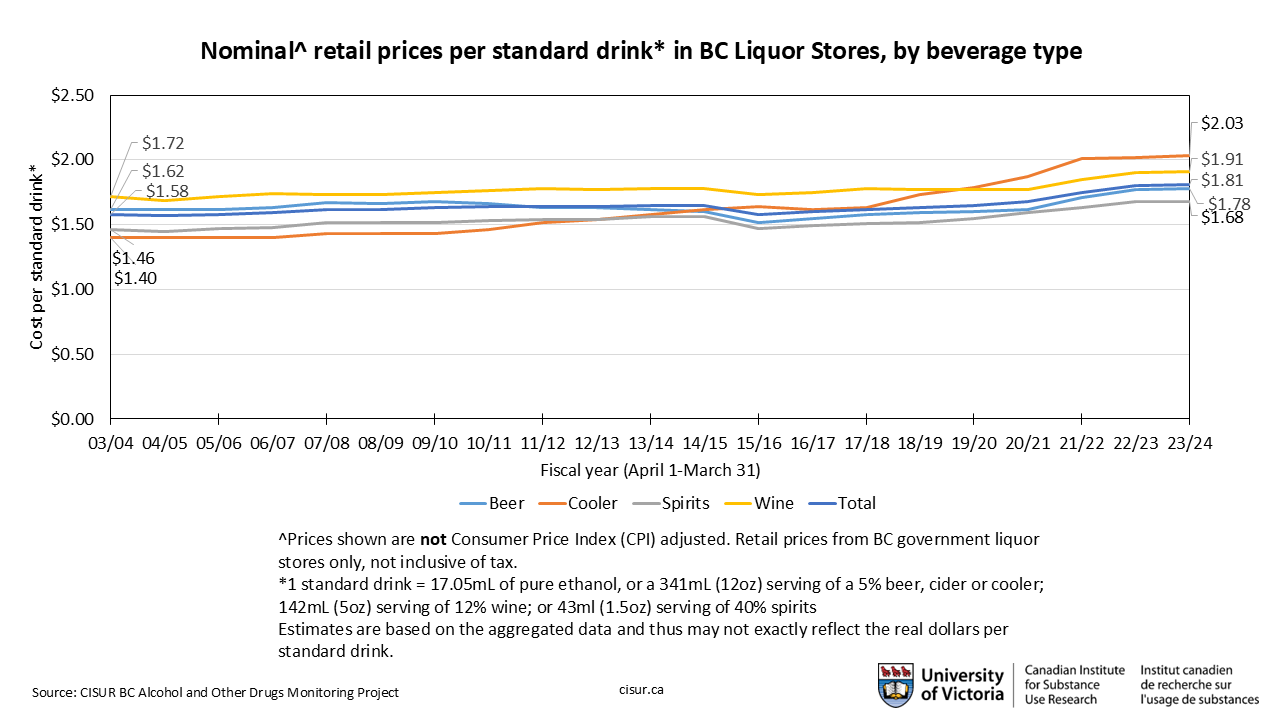
When looking at average ‘nominal’ retail prices of alcoholic beverages in BC over time, the trend appears to be going slightly upwards, with particularly large jumps in total price since 2020/21. However, these are nominal prices, meaning they are not adjusted for inflation.
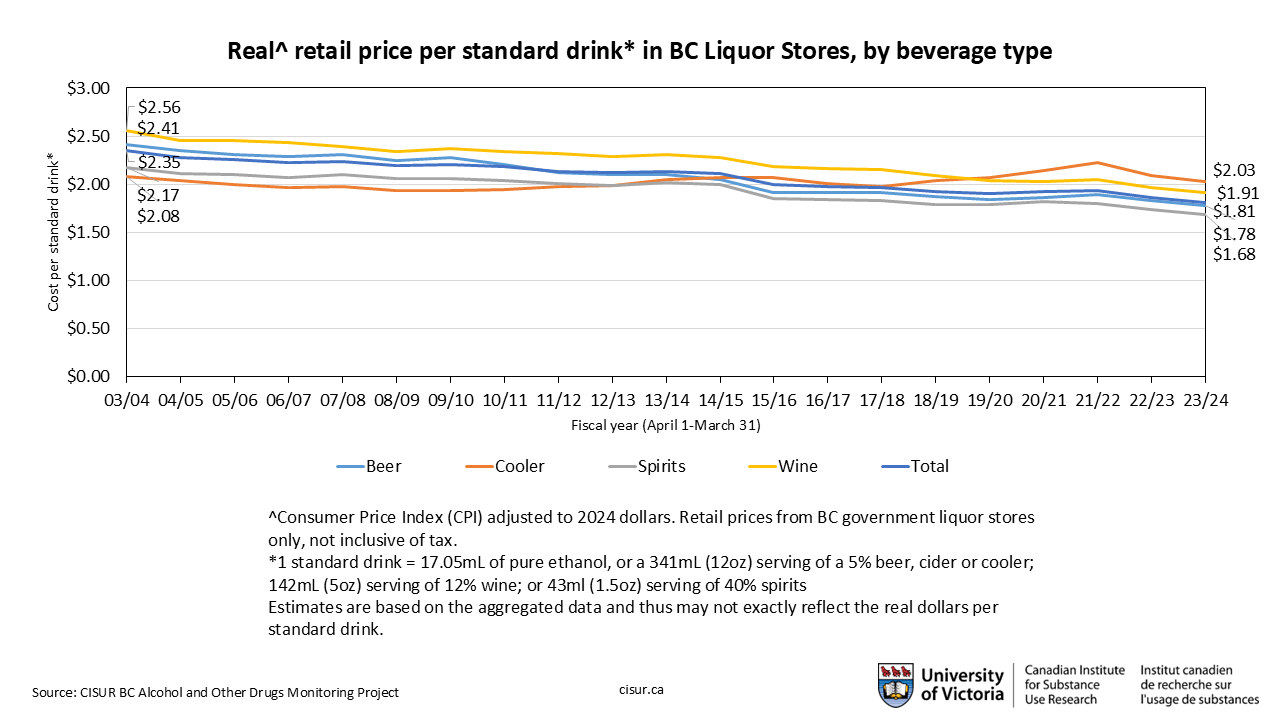
By contrast, when we adjust these prices for inflation, we see that the “real prices” in today’s dollars have declined by more than 25% relative to other goods and services. This reduction in real price means that people are more likely to buy alcohol relative to other products compared to a situation in which alcohol prices keep pace with inflation.
Monthly trends
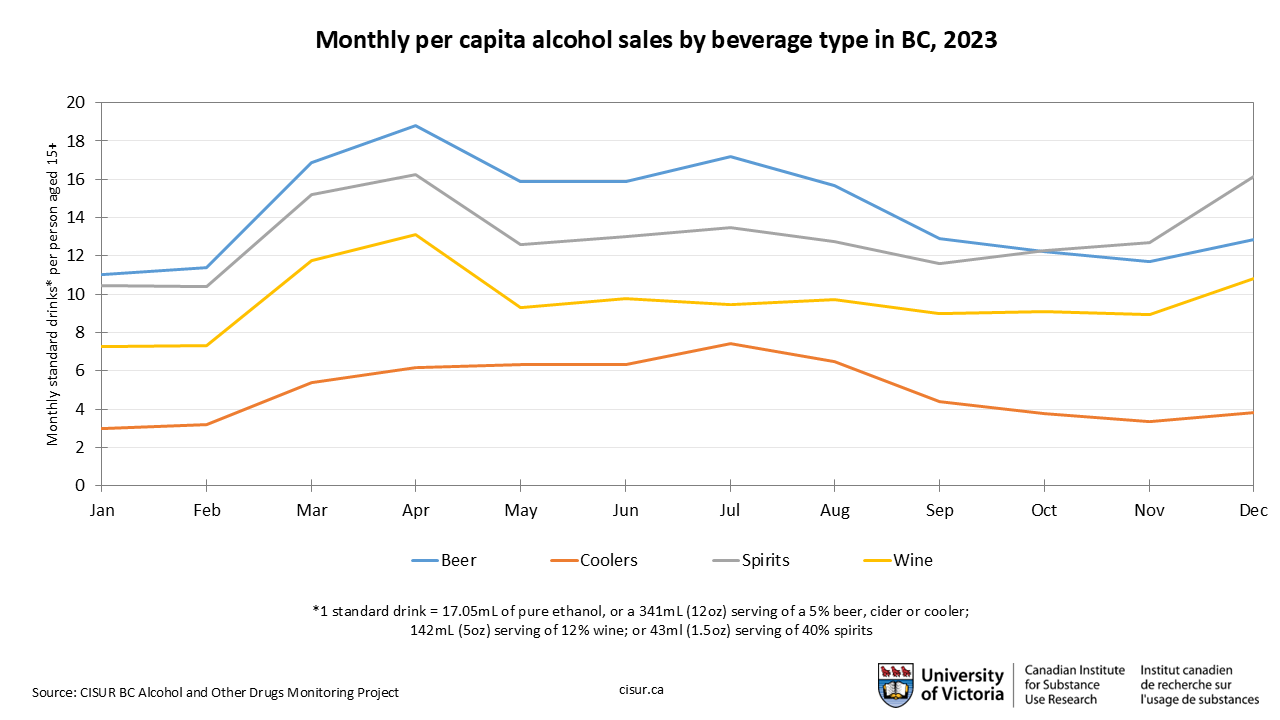
When we look at monthly per capita ethanol sales data by beverage type for 2024, some interesting trends appear. Summer months are popular for beer and coolers, while spirits increase in the fall and surpass beer sales by November. Interestingly, wine consumption remains mostly steady throughout the year.
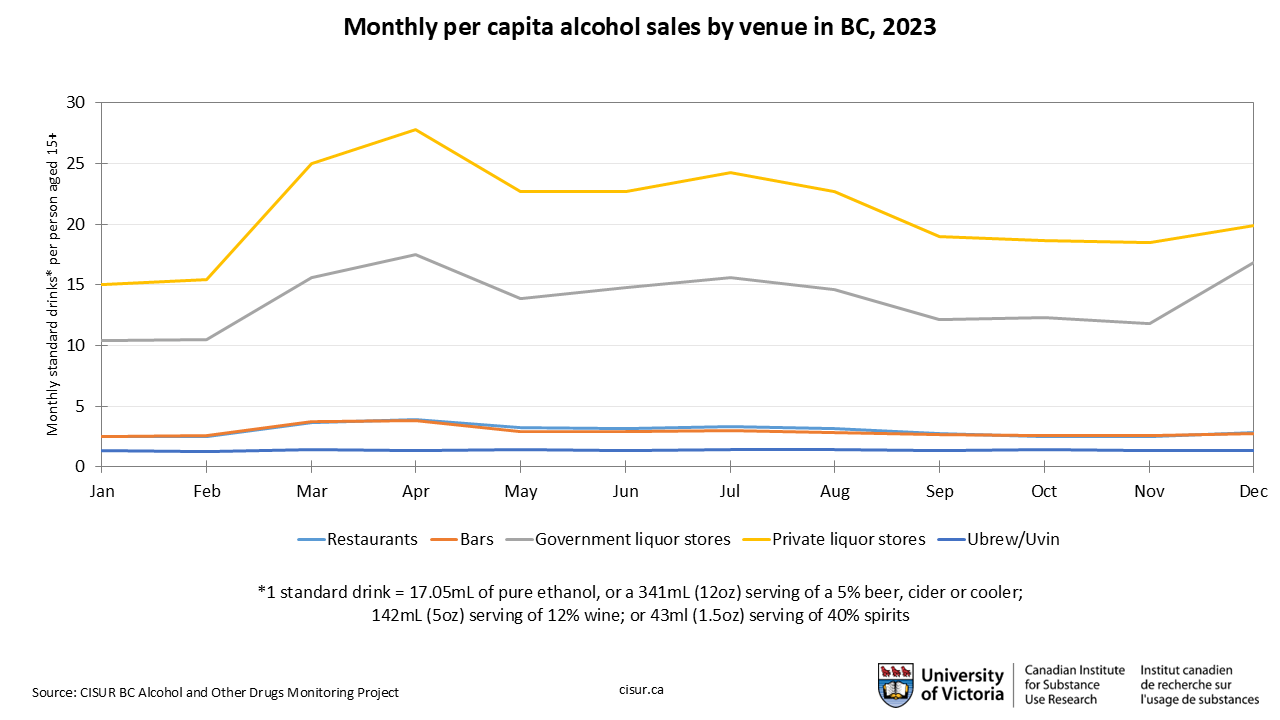
When looking at monthly per capita sales data by venue, private liquor stores are consistently at the top. Sales for all venue types except bars were at their highest in July. In December, we also see an increase in sales at government liquor stores.
Sales by region
Interior Health continues to have the highest levels of per-capita sales in BC, with 653 standard drinks (SDs) per person aged 15+ (or 11.14L of ethanol), Northern and Vancouver Island were almost tied with 566 and 564 SDs respectively (9.65L and 9.61L) while Vancouver Coastal and Fraser were lowest, at 383 SDs (6.53L) and 308 SDs (5.26L) respectively. Interior Health purchases over twice as much alcohol per capita as Fraser Health.
Per capita ethanol sales have fallen in all five health authorities since 2023/24, reflecting the overall decrease seen provincially. The largest decrease was Northern Health, which saw a drop of 37 SDs per capita.
Per capita ethanol sales at the HSDA and LHA level may not be as accurate as at the HA level, as estimates are based on the sales data that might be largely affected by tourists, liquor store locations and other factors (i.e., sales data is based on the location of sales, not necessarily consumption). The estimates thus may not reflect real consumption, particularly in LHAs with small population sizes or smaller geographic area. Note that due to updated BC population estimates from BC Statistics, historic per capita consumption estimates may have changed since last year’s update—the estimates for all years now incorporate the most up-to-date population statistics. Read more about our methodology.
For detailed interactive maps and historical consumption data, please visit our AOD Trend Analyzer tool.
As in the Health Authorities, there is a wide range of per capita ethanol sales rates across different Health Service Delivery Areas (HSDAs) in BC. The two HSDAs with the highest per capita sales rates in BC are East Kootenay (Interior Health) at 698 standard drinks (SDs), or 11.9L of ethanol, and Northwest (Northern) at 691 SDs (11.79L). The HSDAs with the lowest per capita rates were Richmond (Vancouver Coastal) with 213 SDs (3.63L) and Fraser North (Fraser) at 273 SDs (4.65L).
Per capita sales have fallen in all Health Service Delivery Areas since 2023/24, reflecting the overall decrease seen provincially. This is partly attributable to population growth in BC paired with lower sales volumes. It should be noted that some HSDAs have seen larger decreases than others. For example, Northeast (Northern) saw a decrease of 0.6L ethanol per capita since 2023/24, going from 10.58L to 9.98L.
Per capita ethanol sales at the HSDA and LHA level may not be as accurate as at the HA level, as estimates are based on the sales data that might be largely affected by tourists, liquor store locations and other factors (i.e., sales data is based on the location of sales, not necessarily location of consumption - this is particularly the case when examining smaller geographical areas like LHAs). The estimates thus may not reflect real consumption, particularly in LHAs with small population sizes or smaller geographic area. Note that due to updated BC population estimates from BC Statistics, historic per capita consumption estimates may have changed since last year’s update—the estimates for all years now incorporate the most up-to-date population statistics. Read more about our methodology.
For detailed interactive maps and historical consumption data, please visit our AOD Trend Analyzer tool.
Interior Health
South Okanagan is the Local Health Area (LHA) with the highest rate of per-capita sales in Interior Health for 2024/25: 1,240 standard drinks (SD) per person aged 15+, or 21.15L of ethanol. This is over twice the provincial average. It also bucked the downward trend seen in most other jurisdictions, with consumption increasing by five SDs.
Windermere is the second-highest in Okanagan Health at 1,093 SDs (18.63L). The LHA with the lowest rate was Kettle Valley at 408 SDs (6.96L) and one of only two LHAs in Interior Health below the BC average of 435 SDs (7.42L).
Per capita rates were down in most LHAs, reflecting the overall provincial trend. This is likely due to an increase in population in BC paired with lower overall sales. Exceptions were South Okanagan and Revelstoke, which saw very small increases. North Thompson saw a large decrease of 1.63L between 2023/24 and 2024/25.
Per capita ethanol sales at the HSDA and LHA level may not be as accurate as at the HA level, as estimates are based on the sales data that might be largely affected by tourists, liquor store locations and other factors (i.e., sales data is based on the location of sales, not necessarily consumption). The estimates thus may not reflect real consumption, particularly in LHAs with small population sizes or smaller geographic area. Note that due to updated BC population estimates from BC Statistics, historic per capita consumption estimates may have changed since last year’s update—the estimates for all years now incorporate the most up-to-date population statistics. Read more about our methodology.
For detailed interactive maps and historical consumption data, please visit our AOD Trend Analyzer tool.
Fraser Health
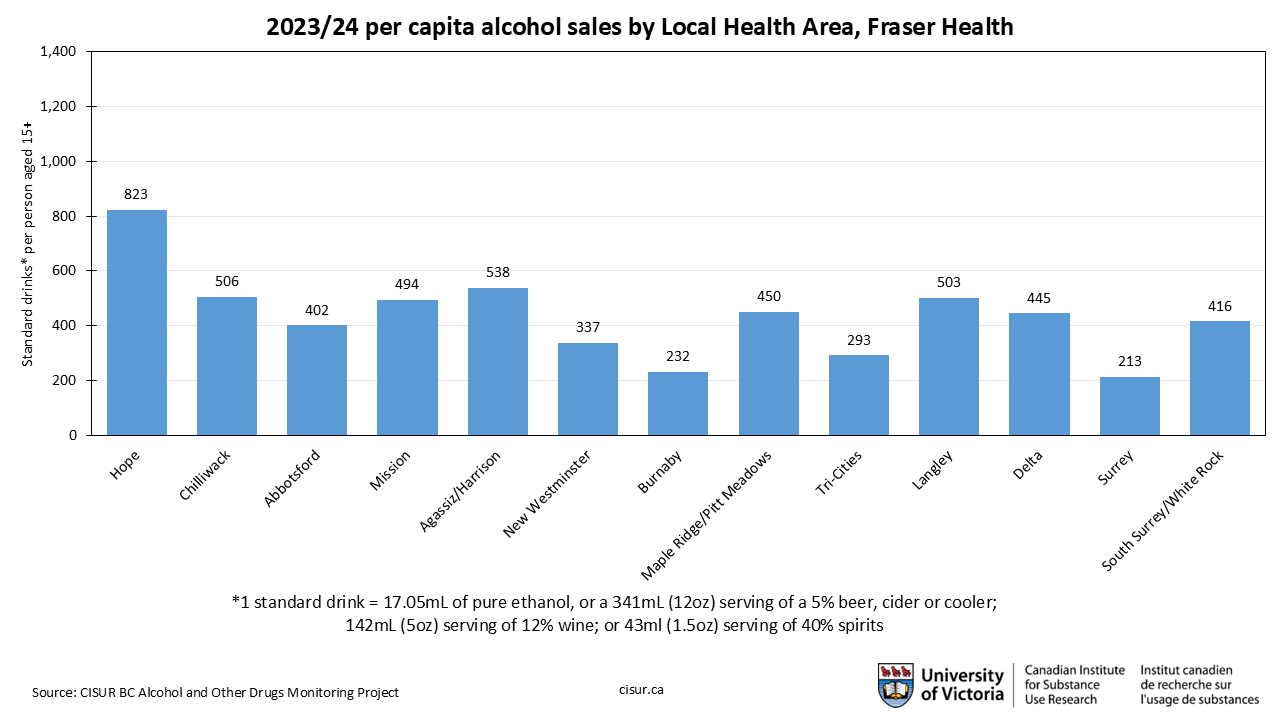
Hope had the highest per capita sales rate for any Local Health Area (LHA) in Fraser Health in 2024/25, at 809 standard drinks (SDs) per person aged 15+ (13.8L of ethanol). Surrey has the lowest per-capita sales rate in Fraser Health at 195 SDs (3.32L).
Per capita rates were down in all LHAs in Fraser Health, reflecting the overall provincial trend. This is likely due to an increase in population in BC paired with lower overall sales.
Per capita ethanol sales at the HSDA and LHA level may not be as accurate as at the HA level, as estimates are based on the sales data that might be largely affected by tourists, liquor store locations and other factors (i.e., sales data is based on the location of sales, not necessarily consumption). The estimates thus may not reflect real consumption, particularly in LHAs with small population sizes or smaller geographic area. Note that due to updated BC population estimates from BC Statistics, historic per capita consumption estimates may have changed since last year’s update—the estimates for all years now incorporate the most up-to-date population statistics. Read more about our methodology.
For detailed interactive maps and historical consumption data, please visit our AOD Trend Analyzer tool.
Vancouver Coastal Health
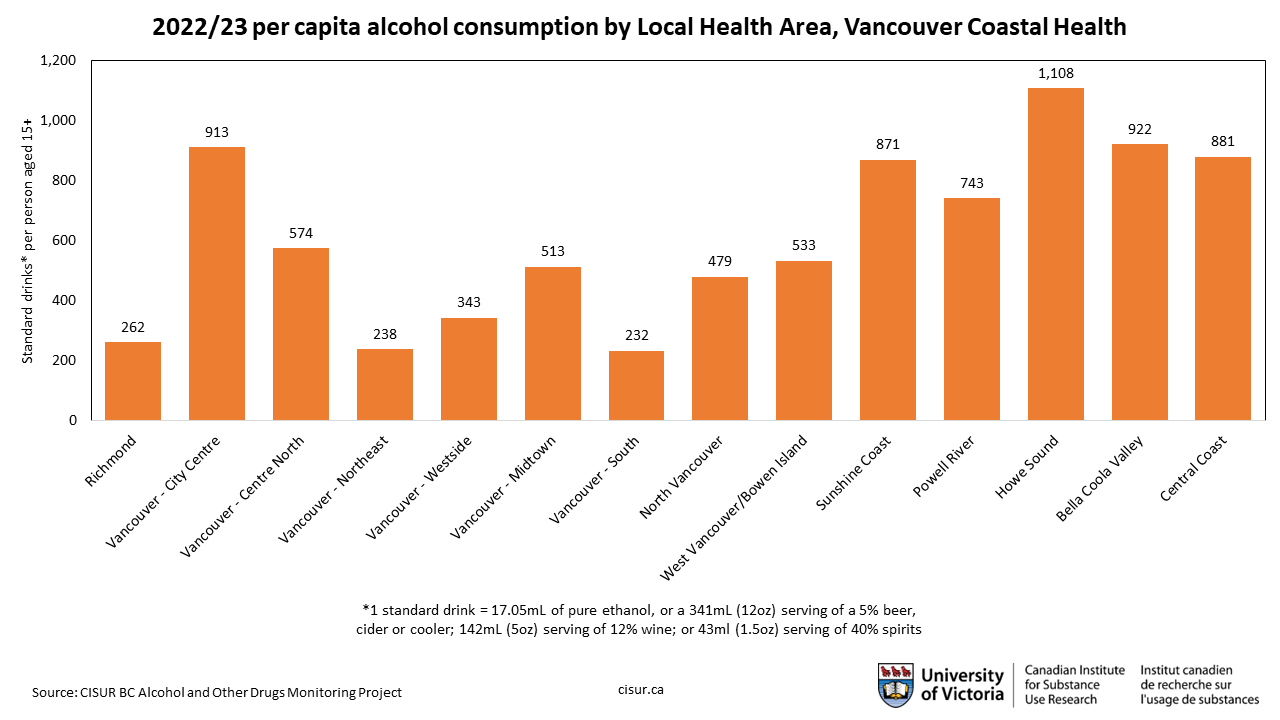
The Local Health Area (LHA) in Vancouver Coastal Health with the highest per-capita ethanol sales in 2023/24 was Howe Sound at 1,015 standard drinks (SDs) per person aged 15+, or 17.3L of ethanol. While the highest, this was a large decrease from 2023/24, when consumption was 1091 SDs (18.61L). The LHA with the lowest rate in Vancouver Coastal (and in all of BC) was Vancouver-South at 172 SDs 2.94L).
Per capita rates were down in most LHAs in Vancouver Coastal Health, reflecting the overall provincial trend. This is likely due to an increase in population in BC coupled with lower overall sales. The only exception was Central Coast, which went from 716 SDs (12.2L) in 2023/24 to 770 SDs (13.13L) in 2024/25.
Per capita ethanol sales at the HSDA and LHA level may not be as accurate as at the HA level, as estimates are based on the sales data that might be largely affected by tourists, liquor store locations and other factors (i.e., sales data is based on the location of sales, not necessarily consumption). The estimates thus may not reflect real consumption, particularly in LHAs with small population sizes or smaller geographic area. Note that due to updated BC population estimates from BC Statistics, historic per capita consumption estimates may have changed since last year’s update—the estimates for all years now incorporate the most up-to-date population statistics. Read more about our methodology.
For detailed interactive maps and historical consumption data, please visit our AOD Trend Analyzer tool.
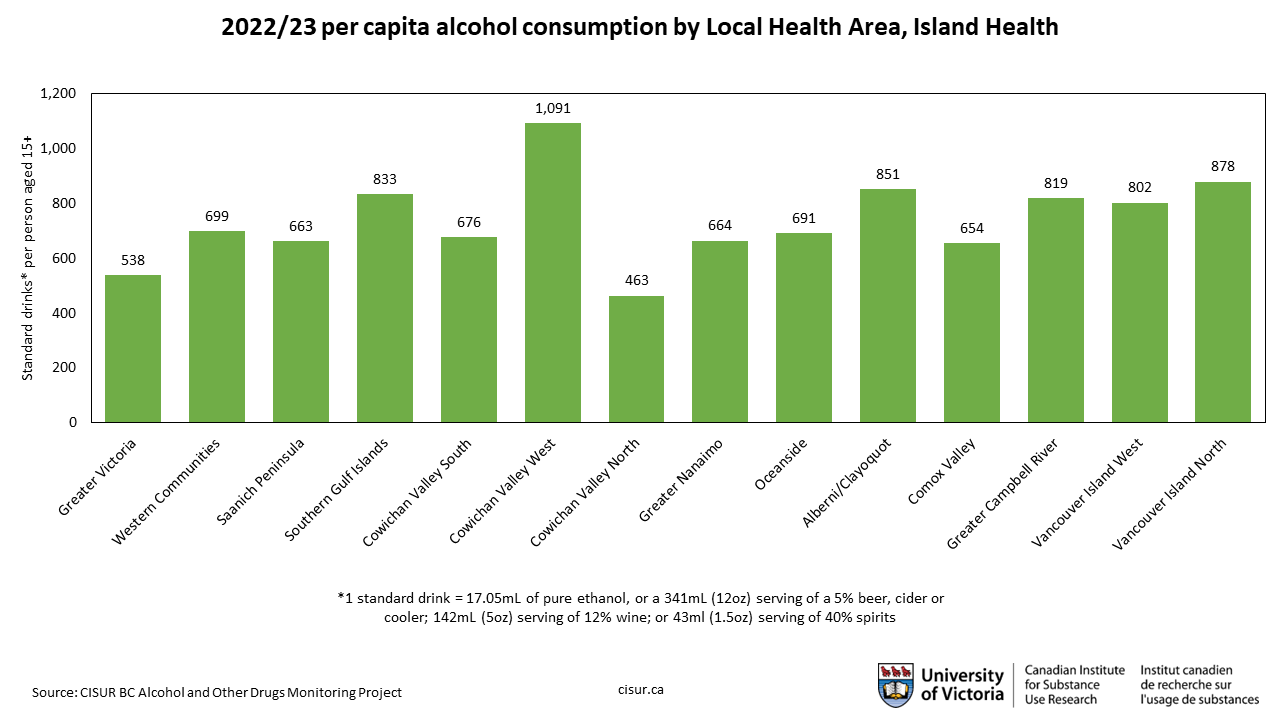
Island Health
Stikine was the Local Health Area (LHA) in Northern Health with the highest rate of per-capita ethanol sales in 2024/25 at 1,193 standard drinks (SDs) per person aged 15+ (or 20.34L of ethanol). This nearly three times the BC average of 435 SDs (7.42L), and was one of the only LHAs in the province to report an increase over last year. However, it does border Nisga’a and Telegraph Creek, Two LHAs that reported no sales in 2024/25, so this may partly be due to people from outside the LHA travelling there to purchase alcohol and its small population size.
Other than Nisga’a and Telegraph Creek, the LHA with the lowest per-capita sales rate was Prince George at 479 SDs (8.69L), which was still above the BC average of 435 SDs.
Per capita ethanol sales were down in almost all LHAs in Northern Health, reflecting the overall provincial trend. This is likely due to an increase in population in BC paired with lower overall sales.
Per capita ethanol sales at the HSDA and LHA level may not be as accurate as at the HA level, as estimates are based on the sales data that might be largely affected by tourists, liquor store locations and other factors (i.e., sales data is based on the location of sales, not necessarily consumption). The estimates thus may not reflect real consumption, particularly in LHAs with small population sizes or smaller geographic area. Note that due to updated BC population estimates from BC Statistics, historic per capita consumption estimates may have changed since last year’s update—the estimates for all years now incorporate the most up-to-date population statistics. Read more about our methodology.
For detailed interactive maps and historical consumption data, please visit our AOD Trend Analyzer tool.
Northern Health
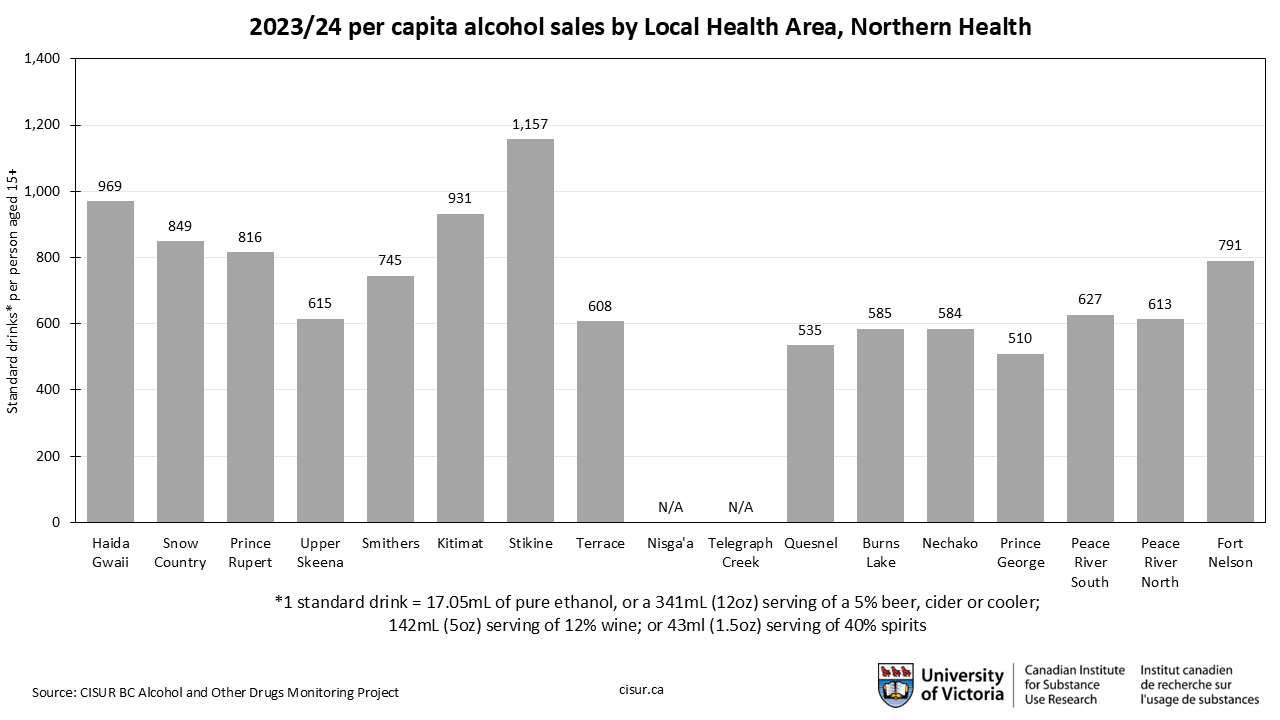
Stikine was the Local Health Area (LHA) in Northern Health with the highest rate of per-capita ethanol sales in 2023/24 at 1,157 standard drinks (SDs) per person aged 15+ (or 19.72L of ethanol). This nearly three times the BC average of 469 SDs (8L), making it the highest rate of per-capita sales of any LHA in BC. However, it does border Nisga’a and Telegraph Creek, Two LHAs that reported no sales in 2023/24, so this may partly be due to people from outside the LHA travelling there to purchase alcohol and its small population size.
Other than Nisga’a and Telegraph Creek, the LHA with the lowest per-capita sales rate was Prince George at 510 SDs (8.69L), which was still above the BC average of 469 SDs.
Per capita ethanol sales were down in all LHAs in Northern Health except for Fort Nelson (which went from 13.43Ls to 13.48Ls) reflecting the overall provincial trend. This is likely due to an increase in population in BC paired with lower overall sales.
Per capita ethanol sales at the HSDA and LHA level may not be as accurate as at the HA level, as estimates are based on the sales data that might be largely affected by tourists, liquor store locations and other factors (i.e., sales data is based on the location of sales, not necessarily consumption). The estimates thus may not reflect real consumption, particularly in LHAs with small population sizes or smaller geographic area. Note that due to updated BC population estimates from BC Statistics, historic per capita consumption estimates may have changed since last year’s update—the estimates for all years now incorporate the most up-to-date population statistics. Read more about our methodology.
For detailed interactive maps and historical consumption data, please visit our AOD Trend Analyzer tool.
Alcohol sales in BC in early COVID months
We estimated per capita alcohol consumption using alcohol sales data from the British Columbia (BC) provided by the British Columbia Liquor Distribution Branch (BCLDB) and the population data projected by BC Stats during the period from January to December 2012-2019 and January to July 2020.
Estimates were made of the monthly number of standard drinks (SD=17.05 mL or 13.45 g of pure alcohol) consumed per adult aged 15 years or older in total, by type of outlets (restaurant, bar, government liquor store and private liquor store) and type of alcoholic beverages (beer, cooler, spirit and wine) during the period from January to December 2012-2019 and January to July 2020. Given that the sales data here represents when the BCLDB sold wholesale products to outlets and not when someone purchased the product at a licensed establishment or liquor store, there is a delay between the sale to the outlet and the purchase by the individual consumer.
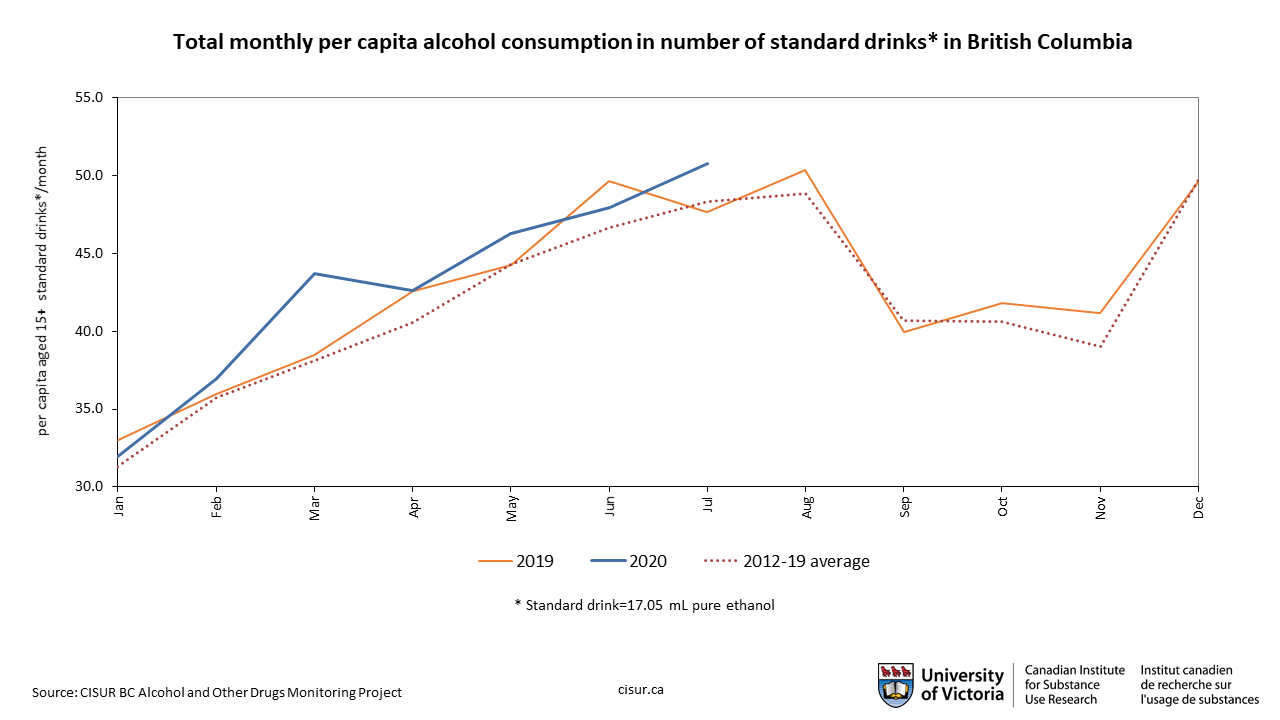
The above chart shows estimates of per capita monthly standard drinks of total alcohol consumption during the pandemic period from January to July 2020, January to December 2019 and average of per capita monthly standard drinks in 2012-2019. There have been seasonal changes in alcohol consumption in BC over years, with lowest consumption in January and February of every year, with peaks over the summer and in December. However, consumption during the pandemic in 2020 tended to have a different pattern. There was a marked increase in March, a slight decrease in April and gradually increased since May. This suggests an effect related to the pandemic and related restrictions declared by the provincial and federal governments. Further research is needed.
In July 2020, the most recent month for which we have sales data, alcohol consumption peaked at about 50 standard drinks per month for every person aged 15+ in BC, which is almost two drinks a day. According to the 2017 Canadian Tobacco, Alcohol and Drug Survey, the current male and female drinkers accounted for 77.29% and 73.34% of population aged 15. Adding unrecorded alcohol consumption such as home-made to the estimates would further increase average consumption. Monthly alcohol consumption in BC in the first half of 2020 was mostly higher compared with previous years.
Consumption by BC Restart Phase
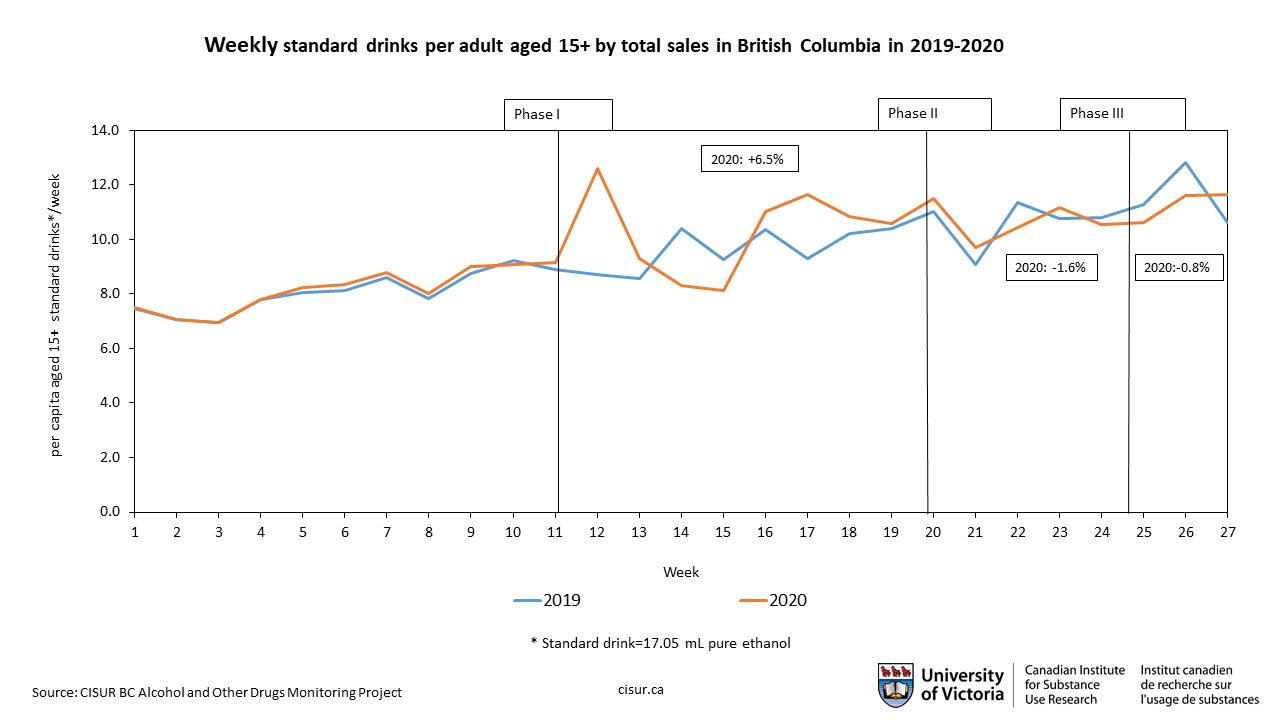
This figure shows per capita weekly 2020 consumption compared to that of 2019, with various Phases of BC’s Restart Plan marked. As we can see, the largest increase in consumption (over 40 percent) was immediately after Phase 1 in March (the first major lockdown) was announced, although it was also the phase with two weeks of the lowest consumption drops, likely due to stockpiling early on in the phase. However, overall consumption in this phase remained above 2019 levels, with slight dips in Phase 2 and the beginning of Phase 3, with consumption starting to go above 2019 levels by July.
Deseasonalized monthly consumption
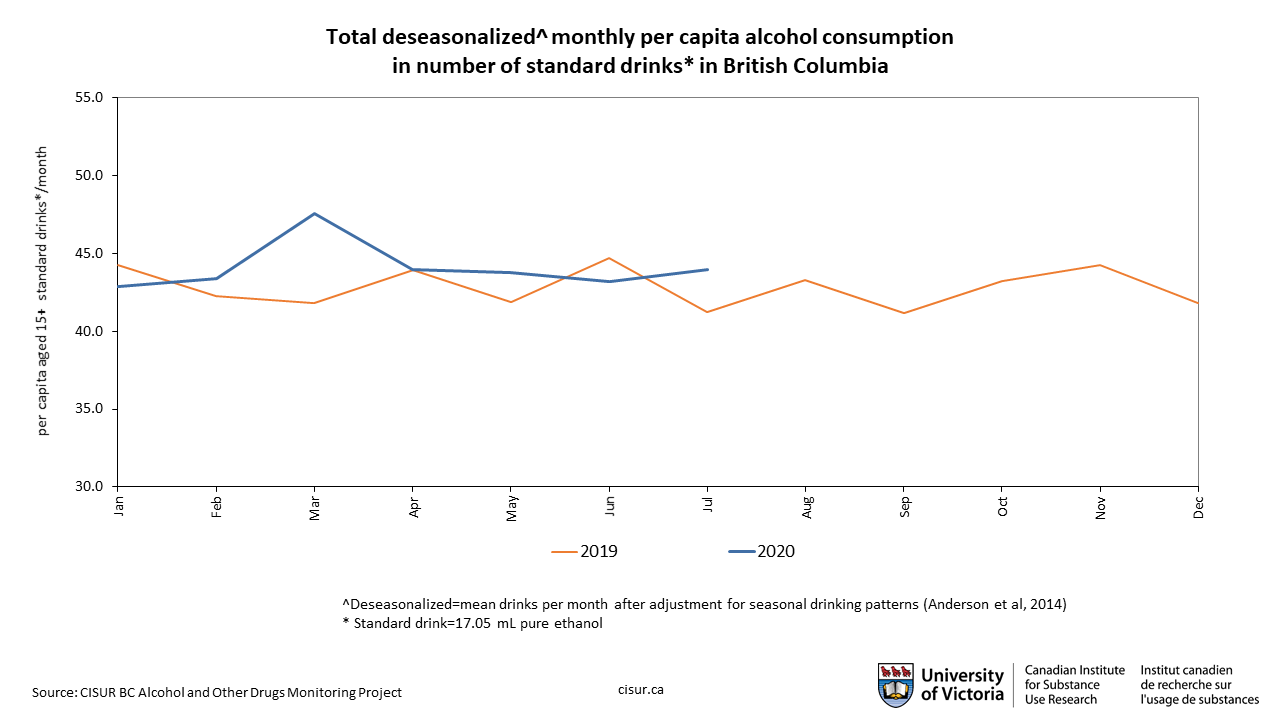
This chart and all following figures all present ‘de-seasonalised’ data to see how monthly alcohol consumption compares with the levels typically seen previously for that time of year. This figure shows a peak of increased consumption during the lockdown in March 2020, followed by levels that were mostly equal to or higher than in 2019.
Consumption by venue
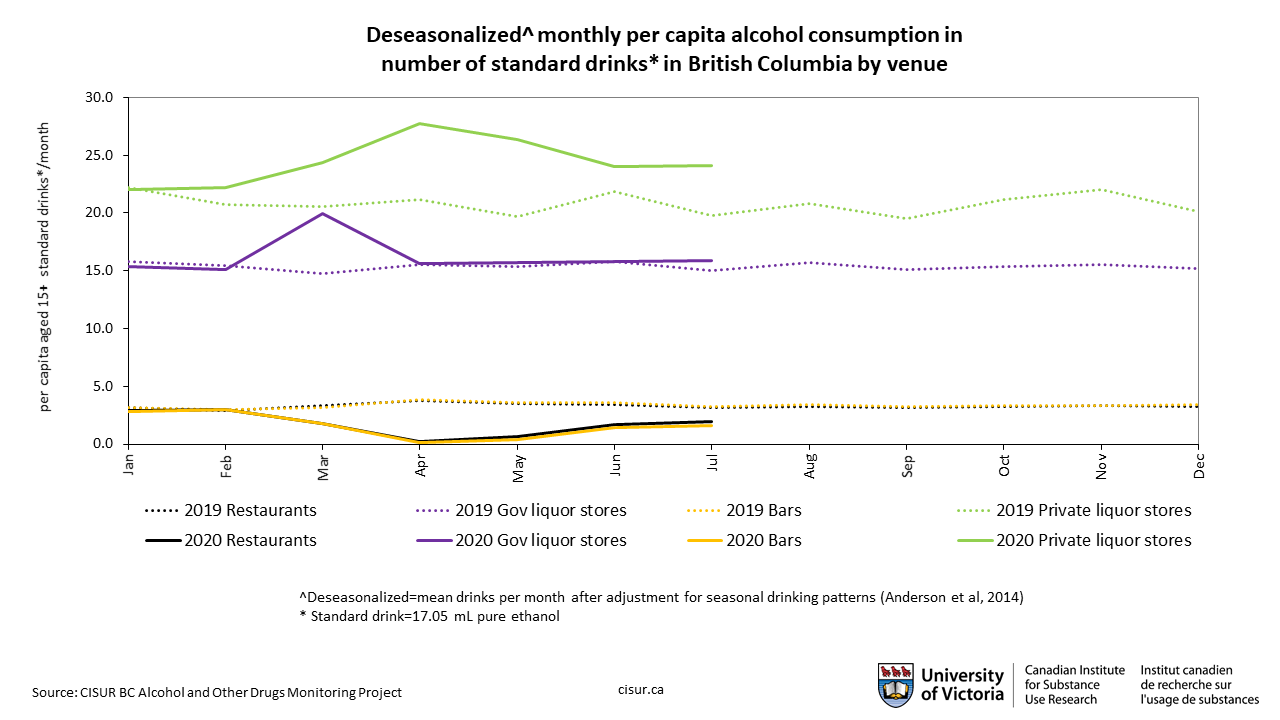
This figure presents the estimates of per capita monthly standard drinks by establishments (restaurant, bar, government liquor stores and private liquor stores) in January-July of 2020 and all of 2019. After removing the seasonality, we see that private liquor stores had the largest sales increase over 2019, with government stores seeing a small increase after a March bump. Sales at bars and restaurants declined during COVID-19, which is unsurprising given the closure of many on-premise venues at the beginning of the lockdown.
As lockdown measures were relaxed, in-person dining was allowed to resume and restaurants were allowed to sell take-away alcohol with food orders, restaurants and bars did see some sale increases over the summer, but only to about half of what they were during the same period in 2019. While both private and government liquor stores saw a large increase in sales at the beginning of the lockdown in March, the greatest increase in alcohol sales occurred for private liquor stores.
Private stores saw their sales peak in April (government stores saw their peak in March, which may be because data for government sales is point-of-sale, as opposed to when venues purchasing from the government wholesaler) and have remained well above their average for the same time period in 2019. This may be due to the fact that private stores have expanded services such as home deliveries, many of which require minimum order thresholds which could encourage bulk buying. Private stores were also permitted to change their operating hours from 7am-11pm, although it is unclear if many outlets have taken advantage of this. Alcohol delivery from liquor stores has also been increasingly available on food-delivery apps, but not for government liquor stores. Further research is needed.
Consumption by beverage type
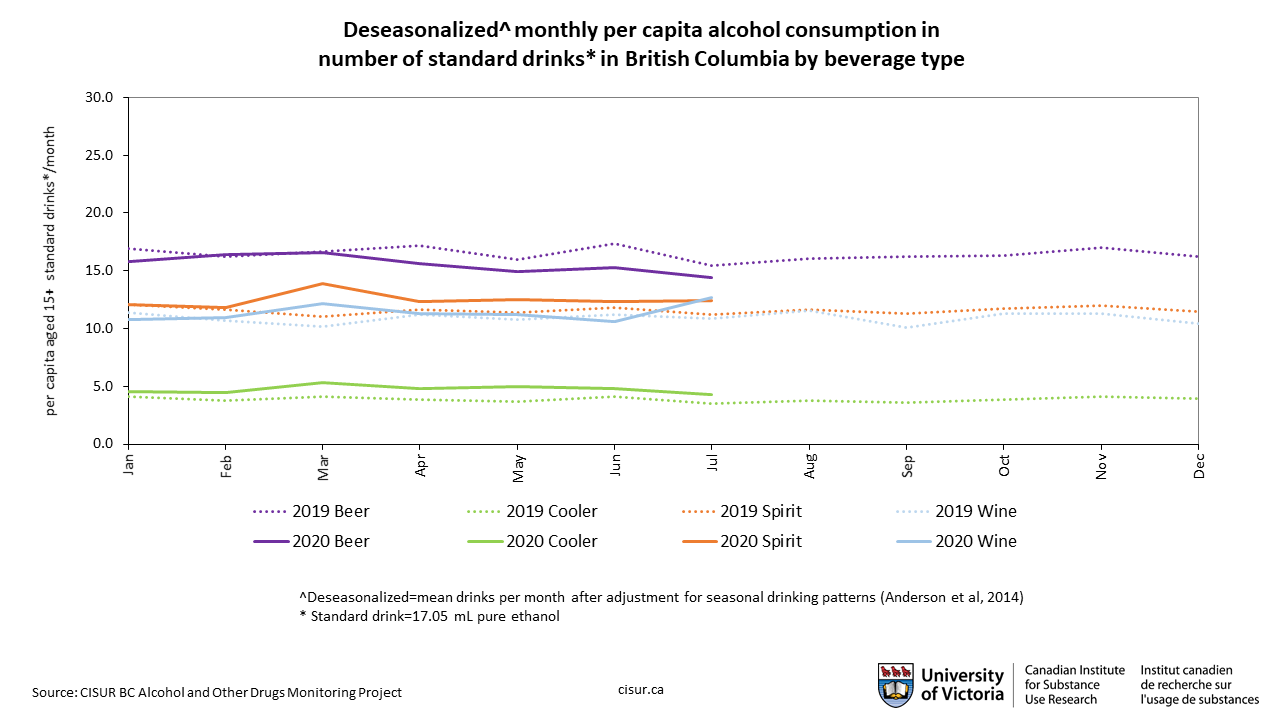
This chart presents the estimates of per capita monthly standard drinks by types of alcoholic beverages (beer, cooler, spirit and wine) in January-July of 2020 and for all of 2019. Compared to monthly 2019 data, spirits and coolers showed the most consistent increase in sales, with wine and spirits experiencing a noticeable bump in March 2020 when lockdown orders came into effect (wine sales have varied slightly compared to the same monthly periods in 2019, but are seeing stronger sales overall). Beer sales have declined compared to 2019 since the COVID-19 pandemic hit.