Communicating Net-Zero Climate Policy via an Interactive Visualization Dashboard
Erica Attard1, Dr. Charles Perin2, Dr. Madeleine McPherson1*
1 Sustainable Energy Systems Integration & Transitions Group, University of Victoria, BC, Canada. 2 Department of Computer Science, Unviersity of Victoria, BC, Canada. * Correspondence: mmcpherson@uvic.ca
Key messages
- Energy models are important tools for decision making, but the communication gap between stakeholders and energy modelers limits their potential value
- A visualization dashboard has been developed to address this gap and facilitate dialogue
- Expansions and applications for the dashboard have been uncovered from stakeholder feedback, widening the impact and user range of the dashboard
Importance: Energy models are important tools for evidence-based decision-making
Energy models are helpful tools that can be used to explore ‘what if’ scenarios, assess decarbonization pathways and policy options (McPherson, 2022), and provide insights for authorities such as the World Energy Council and the Intergovernmental Panel on Climate Change (Riahi & Krey, 2022). However, a communication gap between stakeholders and energy modelers impedes the impact energy modeling has on decision-making. These obstacles include ineffective or incomplete communication of model formulation (McPherson, 2022), as well as a lack of transparency, reproducibility (Huppmann, 2018), and accessibility of inputs and outputs (Nikas, 2021). Additionally, a variety of stakeholders, such as government, non-governmental organizations, utilities, communities, vulnerable populations and academic institutions, should be engaged with throughout the input development, modeling and results analysis process (Howells, 2011). Based on these obstacles, there is a need for a tool to bridge the communication gap between energy modelers and stakeholders that will enable the consideration and evaluation of more diverse decarbonization pathways that can account for a wider range of affected communities and lead Canada to a just transition.
IDEA: bridging the communication gap
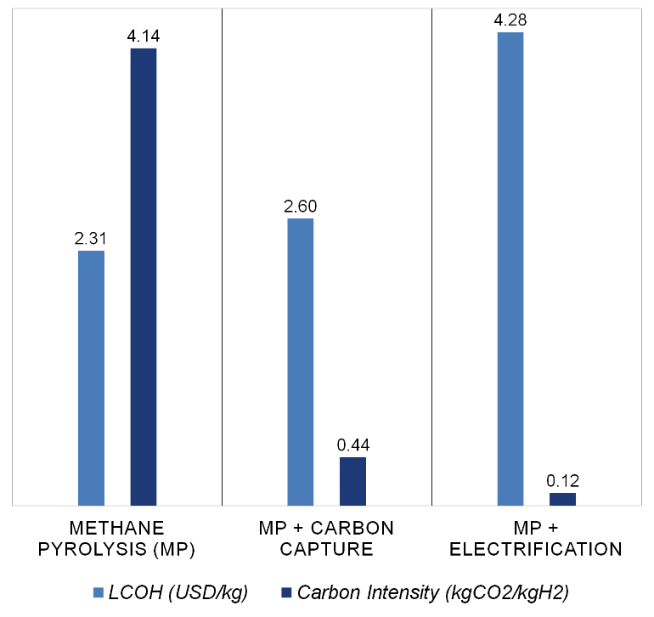
We have developed a flexible, Python-based visualization dashboard, called the Integrated Dashboard for Energy transition Analysis or IDEA, and evaluated its performance in a series of stakeholder engagement sessions. IDEA allows users to customize the plots and gain access to backend data, improving accessibility and transparency. Figure 1 shows an example of two tabs of the dashboard. We used the IDEA platform in engagement sessions with Environment and Climate Change Canada, Natural Resources Canada, Clean Energy Canada, the David Suzuki Foundation, the BC Ministry of Energy, Mines, and Low Carbon Innovation and the BC Climate Action Secretariat; feedback, additions, and future applications were collected and implemented. IDEA has now been used as an analysis tool to dissect results, facilitate collaboration between stakeholders and energy modelers, compare different sets of model results, and evaluate decarbonization policies.
How can IDEA be expanded?
IDEA will continue to be used in a variety of circumstances including policy analysis, model comparisons, and research. In addition, new application areas may emerge. For example, parts of the modeling community are moving away from evaluating several discrete scenarios and towards robust uncertainty methods; IDEA can help focus the investigating and glean insights from an array of scenario options or a scenario suite. Through these applications, we will continue to collect and review suggestions, expanding IDEA’s functionality. These expansions will widen the range of users for IDEA, and in turn, it’s impact. Additionally, stakeholders and energy modelers can now leverage IDEA to facilitate evaluations and dialogue surrounding policy options and decarbonization pathways. IDEA is open-sourced and can be accessed through a GitLab repository: https://gitlab.com/sesit/idea-dash. A paper documenting this research is currently in the process of publication. Additionally, a results databased, that is integrated with IDEA, has been created to store historical modeling results and allow users to upload their own results to visualize in IDEA and aid in their research and investigation.
References
McPherson, M, et al. (2022). Open-source modeling infrastructure: Building decarbonization capacity in Canada. Energy Strategy Reviews, vol. 44, p. 100961, 2022. doi:10.1016/j.esr.2022.100961.
Riahi, K, Krey, V. (2022). Model for Energy Supply Strategy Alternatives and their General Environmental Impact (messageix). IIASA. Available: https://iiasa.ac.at/models-tools-data/messageix.
Huppmann, D, et al. (2018). The message integrated assessment model and the IX modeling platform (ixmp): An open framework for integrated and cross-cutting analysis of Energy, climate, the environment, and Sustainable Development. Environmental Modeling. vol. 112, pp. 143–156, 2019. doi:10.1016/j.envsoft.2018.11.012
Nikas, A, et al. (2021). Perspective of comprehensive and comprehensible multi-model Energy and climate science in Europe. Energy. vol. 215, p. 119153, 2021. doi:10.1016/j.energy.2020.119153
Howells, M, et al. (2011). OSeMOSYS : The Open Source Energy Modeling System. Energy Policy. vol. 39, no. 10, pp. 5850–5870, 2011. doi:10.1016/j.enpol.2011.06.033
Communicating Net-Zero Climate Policy via an Interactive Visualization Dashboard PDF